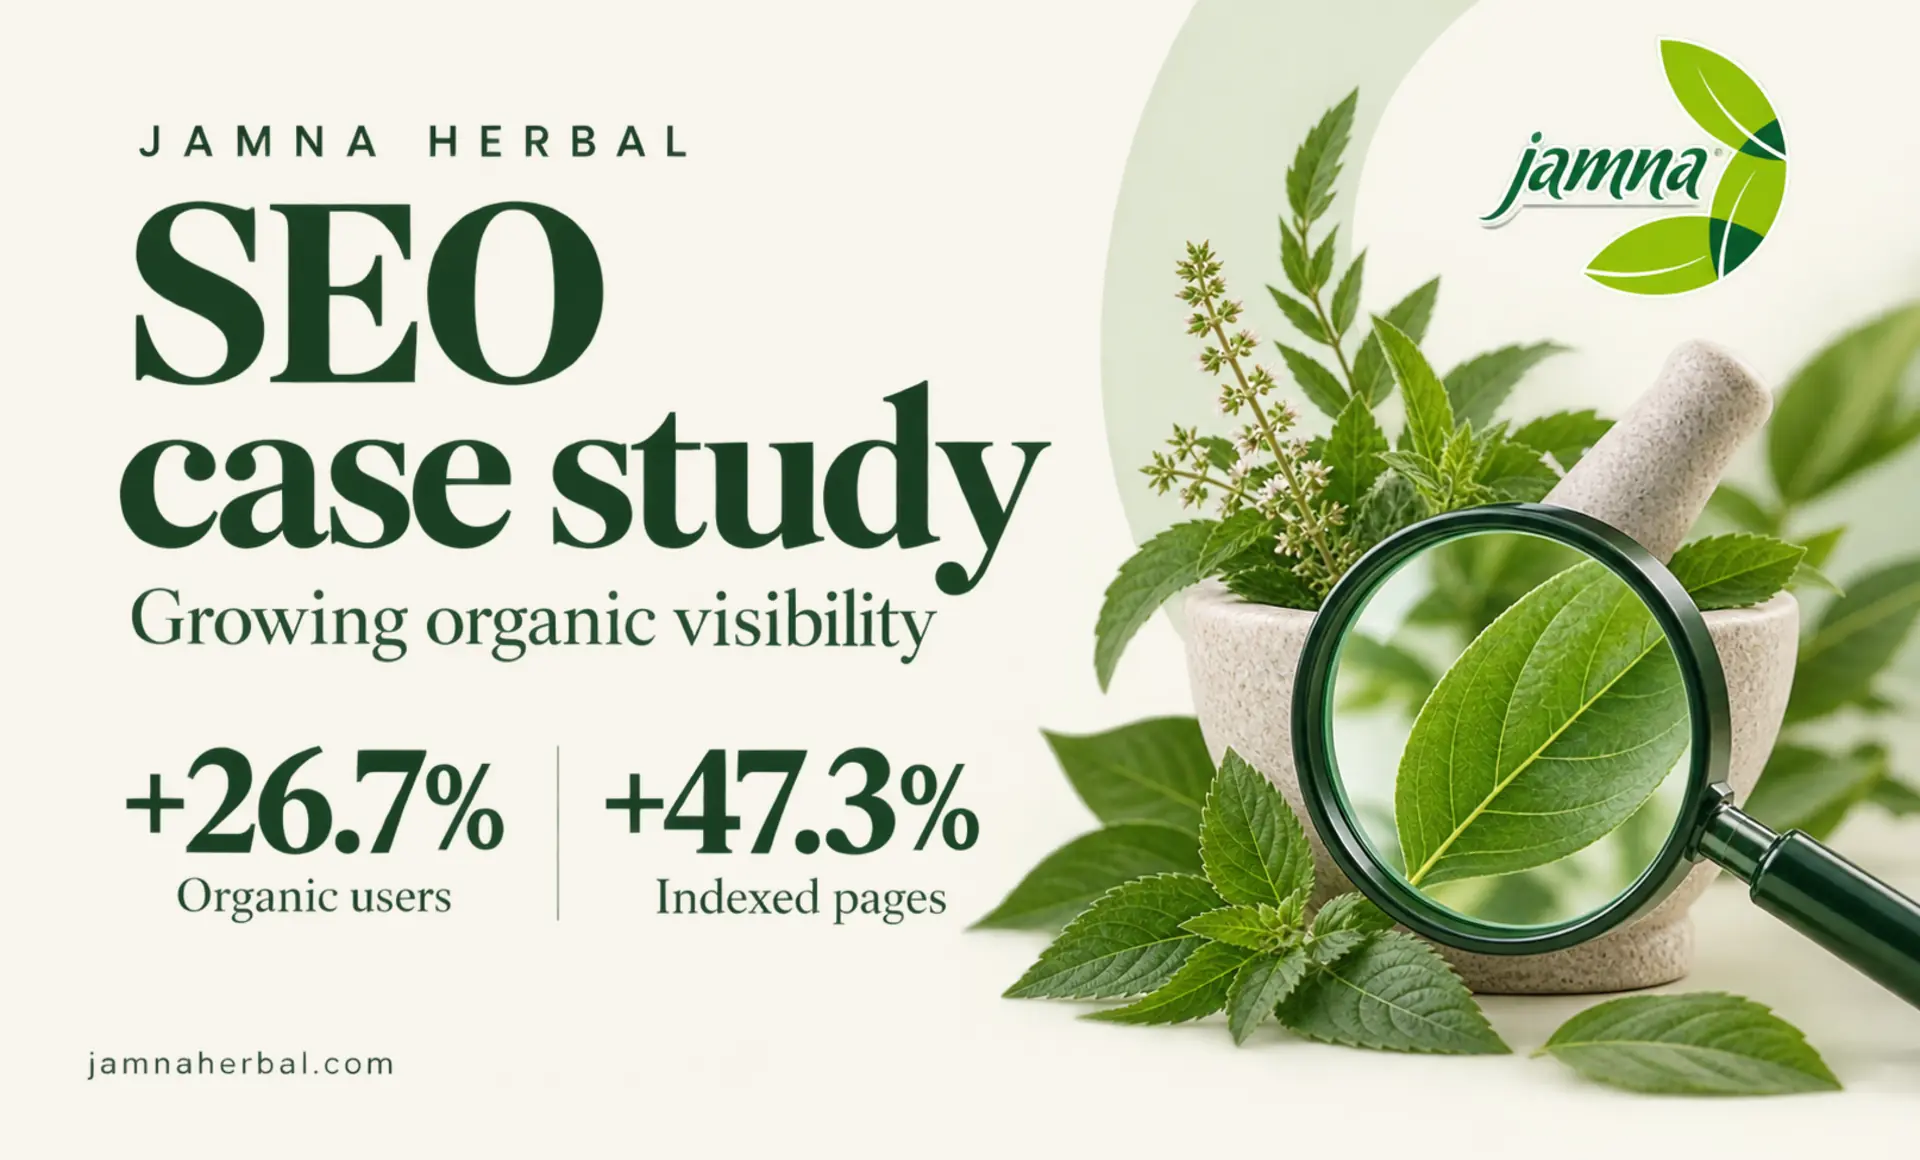
Jamna Herbal SEO Case Study: 47% Growth in Indexed Pages and 26.7% More Organic Users
1. Introduction
Company overview
Jamna Herbal is an Indian Ayurvedic and herbal products business with an ecommerce website covering a wide range of wellness needs, including digestive health, thyroid care, cardiac wellness, joint and muscular pain, skin care, hair care and general wellbeing.
Customers can browse products such as tablets, capsules, syrups, powders and oils directly through the website.
From an SEO point of view, that creates a clear opportunity. An ecommerce site like Jamna Herbal does not rely on its homepage alone. Its real organic growth potential sits across its category and individual product pages.
For those pages to generate traffic, Google first needs to be able to find them, crawl them, understand what they are about and add them to its index.
SEO objective
The campaign focused on building a stronger technical SEO foundation while helping more of Jamna Herbal’s product catalogue appear in organic search.
The main priorities were to:
- Get more pages indexed by Google
- Improve visibility beyond the homepage
- Increase the discoverability of category and product pages
- Expand valid product and breadcrumb structured data
- Encourage more effective crawling of the website
- Maintain strong technical and page-experience signals
- Increase qualified traffic from Organic Search
The results show progress across several of these areas, particularly indexation, structured data, crawl activity and organic acquisition.
2. Background and challenges
Initial situation
Jamna Herbal was already attracting organic traffic, but the data showed that there was still considerable untapped potential across the wider product catalogue.
| Metric | Earlier position |
| Organic Search users | 3,802 |
| Organic Search sessions | 6,243 |
| Organic engaged sessions | 4,310 |
| Organic engagement rate | 69.04% |
| Organic events | 61,011 |
| Indexed pages | 150 |
| Valid Product snippet items | 2 |
| Good Core Web Vitals URLs | 104 |
| Daily crawl requests at visible baseline | 100 |
One important point was to separate organic performance from Paid Social.
Paid Social grew very quickly during the same period, but those results have not been included as SEO gains. This case study focuses only on the performance that can be linked to Organic Search and technical SEO reporting.
Key SEO challenges
Too much of the catalogue was still outside Google’s index
At the visible starting point, Google Search Console showed 150 indexed pages.
For an ecommerce site, this matters because a page that is not indexed cannot appear in search results, regardless of how useful or relevant the product may be.
That meant one of the biggest opportunities was simply to get more of the existing catalogue into Google’s searchable index.
Product structured data had very limited coverage
On 19 March, Search Console showed only 2 valid Product snippet items.
That did not mean the site could not rank, but it did mean Google had relatively limited structured product information available through this report.
Product structured data can help search engines understand ecommerce pages more clearly and can make eligible pages available for enhanced search features.
There was therefore clear scope to improve structured-data coverage across the site.
Organic performance was uneven across landing pages
The landing-page data showed a mixed picture.
The homepage was still the largest source of search clicks, but it declined from 2,000 clicks to 1,738.
At the same time, several product and category pages grew strongly, including:
- /sc/all-products
- /product/thyrocon-tablet-120-tab
- /product/aam-doshantak-capsule-30-cap
- /product/hriday-shakti-syrup-200-ml
This suggested that the bigger opportunity was not simply to grow homepage traffic, but to build more search entry points across the catalogue.
Google needed to crawl more of the site
Search Console showed 100 crawl requests on 26 February, while the crawl report later recorded approximately 10.5K total crawl requests across the reporting period.
By 23 May, the visible daily crawl figure had risen to 183.
More crawling does not automatically mean better rankings. However, when higher crawl activity appears alongside growing indexation and increased visibility for deeper pages, it provides a useful sign that Google is discovering and revisiting more of the website.
3. Strategy development
Research and analysis
The campaign needed to look at SEO as a connected system rather than focusing on rankings in isolation.
Several data sources were therefore important.
Google Analytics 4 helped show whether Organic Search was bringing in more users and whether those users were continuing to interact with the website.
Google Search Console Page Indexing showed whether more URLs were being added to Google’s index.
Crawl Stats provided insight into how frequently Googlebot was requesting site resources.
Product snippets and Breadcrumb reports showed whether Google was recognising more valid structured data.
Core Web Vitals helped monitor the experience of URLs being crawled and indexed.
Finally, landing-page performance showed whether the improvements were translating into real search impressions and clicks across category and product pages.
Goal setting
The data pointed to six clear priorities:
- Increase the number of pages Google could index
- Expand valid ecommerce structured-data coverage
- Improve discovery and recrawling of product and category pages
- Maintain strong page-experience signals
- Grow search visibility beyond the homepage
- Turn improved technical visibility into more Organic Search users and sessions
4. Execution
Indexation and crawl optimisation
Problem
Only 150 pages were indexed at the visible starting point.
For a product-led ecommerce site, this restricted how much of the catalogue could appear in Google Search.
Approach
The campaign focused on improving the site’s overall indexation coverage and giving Google access to more relevant ecommerce URLs.
The reporting provided here confirms the improvement in indexation, although it does not show every individual technical change that contributed to it.
Why it mattered
Every additional indexed product or category page creates another possible route into the website.
Instead of relying heavily on the homepage, the site can begin attracting users through much more specific searches related to products, categories or needs.
Result
Indexed pages increased from 150 on 27 February to 221 on 21 May.
That means:
- 71 additional indexed pages
- 47.3% growth in indexed pages
Crawl activity also increased.
Daily crawl requests rose from 100 on 26 February to 183 on 23 May, an 83% increase between the two visible data points.
Taken together, the figures suggest that Google was discovering and revisiting a wider portion of the site.
Product structured-data coverage
Problem
Only 2 valid Product snippet items were visible in Search Console on 19 March.
Approach
Product structured-data coverage expanded significantly over the following weeks.
The reporting confirms the improvement in recognised valid items, although the screenshots do not document the exact implementation method used.
Why it mattered
Structured data gives search engines clearer information about the content of a product page.
It does not guarantee higher rankings or rich results, but it can improve Google’s understanding of ecommerce content and make qualifying pages eligible for enhanced search appearances.
Result
Valid Product snippet items grew from:
2 → 59
That represents:
- 57 additional valid items
- 2,850% growth
By 25 May, Search Console showed:
- 59 valid items
- 0 invalid items
The percentage growth is naturally very high because the starting point was only two items. The more meaningful result is that valid coverage expanded from just 2 recognised items to 59.
Breadcrumb structured data
Breadcrumb structured-data coverage also improved during the reporting period.
The first visible point in the chart showed approximately 1 recognised item. By the end of the reporting period, Search Console showed:
- 9 valid breadcrumb items
- 0 invalid items
Breadcrumbs help search engines understand how pages sit within the wider site structure.
That is particularly useful for ecommerce websites where products may sit several levels deep beneath categories and subcategories.
Core Web Vitals and page experience
The Desktop Core Web Vitals data also moved in a positive direction.
On 1 May, the chart showed:
104 URLs classified as Good
By 24 May:
135 URLs classified as Good
That represents:
- 31 additional Good URLs
- 29.8% growth
There is a small reporting inconsistency in the screenshots. The summary cards show zero issue groups, while the chart tooltips show 104 and 135 URLs in the Good category.
For this reason, the URL counts shown in the chart have been used for the comparison.
Core Web Vitals should not be treated as the single reason behind traffic growth. However, the data shows that the growing indexed footprint was also accompanied by more URLs falling into the Good page-experience category.
Organic search visibility
The technical improvements were accompanied by stronger Organic Search performance.
GA4 compares:
1 January – 30 April 2024
with:
1 September – 31 December 2023
Organic Search performance changed as follows:
| Organic metric | Sep–Dec 2023 | Jan–Apr 2024 | Change |
| Users | 3,802 | 4,817 | +26.7% |
| Sessions | 6,243 | 7,703 | +23.39% |
| Engaged sessions | 4,310 | 5,514 | +27.94% |
| Engagement rate | 69.04% | 71.58% | +2.54 percentage points |
| Engaged sessions per user | 1.13 | 1.14 | +0.98% |
| Events per session | 9.77 | 10.57 | +8.16% |
| Event count | 61,011 | 81,419 | +33.45% |
| Avg. engagement time per session | 1m 39s | 1m 35s | -4.23% |
The most important point is that traffic did not simply increase.
Organic users, sessions and engaged sessions all grew, while engagement rate and events per session also improved.
Average engagement time did fall slightly from 1 minute 39 seconds to 1 minute 35 seconds, so the results are better understood across the full set of engagement metrics rather than by focusing on one figure alone.
5. Implementation timeline
| SEO area | Evidence/reporting window |
| Crawl monitoring | 26 February – 23 May 2024 |
| Page indexation | 27 February – 21 May 2024 |
| Product structured data | 19 March – 25 May 2024 |
| Breadcrumb structured data | Mainly visible during May 2024 |
| Core Web Vitals | 1 May – 24 May 2024 |
| Organic acquisition comparison | Jan–Apr 2024 vs Sep–Dec 2023 |
| Landing-page performance | Jan–Apr 2024 vs Sep–Dec 2023 |
These are reporting windows rather than confirmed implementation dates.
6. Results
SEO performance results
| Metric | Before | After | Improvement |
| Organic users | 3,802 | 4,817 | +26.7% |
| Organic sessions | 6,243 | 7,703 | +23.39% |
| Organic engaged sessions | 4,310 | 5,514 | +27.94% |
| Organic event count | 61,011 | 81,419 | +33.45% |
| Organic engagement rate | 69.04% | 71.58% | +2.54 pp |
| Events per Organic session | 9.77 | 10.57 | +8.16% |
| Indexed pages | 150 | 221 | +47.33% |
| Valid Product snippet items | 2 | 59 | +2,850% |
| Good Desktop CWV URLs | 104 | 135 | +29.81% |
| Daily crawl requests at compared points | 100 | 183 | +83% |
| Valid breadcrumb items from first visible point | 1 | 9 | +800% |
Key performance highlights
47.3% more indexed pages
150 → 221
26.7% more Organic Search users
3,802 → 4,817
23.4% more Organic Search sessions
6,243 → 7,703
27.9% more engaged organic sessions
4,310 → 5,514
33.5% more organic events
61,011 → 81,419
Product snippet coverage increased from 2 to 59 valid items
29.8% more URLs were classified as Good in the visible Core Web Vitals data
104 → 135
The biggest SEO wins
Indexed pages increased by 47.3%
The number of indexed pages rose from 150 to 221, giving Google 71 more URLs that could potentially appear in search results.
For an ecommerce website, that is a meaningful change.
Organic growth cannot come from pages that Google has not indexed. By increasing the indexed footprint, Jamna Herbal created more opportunities for customers to land directly on relevant product and category pages.
That is especially important because shoppers do not always begin with a brand search. They may search for a specific product, condition, ingredient or type of remedy.
More indexed URLs mean more chances to meet those searches with a relevant page.
Organic Search users grew by 26.7%
Organic users increased from 3,802 to 4,817.
That is:
- 1,015 additional Organic Search users
- 26.7% growth
Organic sessions also increased from 6,243 to 7,703.
This growth is particularly useful because it can be separated from Paid Social.
Paid Social grew significantly during the same period, but those results have not been included in the SEO figures. The Organic Search increase therefore stands on its own.
Engagement remained healthy as organic traffic grew
More traffic is useful, but only if those visitors actually interact with the site.
In this case, engagement remained strong.
Organic engagement rate improved from:
69.04% → 71.58%
Events per session increased from:
9.77 → 10.57
Engaged sessions also grew by 27.94%, slightly faster than overall organic sessions.
Average engagement time declined slightly, from 1 minute 39 seconds to 1 minute 35 seconds.
Rather than hiding that decline, it is more useful to look at the overall picture. Users were arriving in larger numbers, engaged sessions increased and visitors were completing more events per session.
Valid Product snippet coverage increased from 2 to 59 items
One of the clearest technical improvements was the growth in Product snippet coverage.
Google Search Console went from recognising just 2 valid items to 59.
That is 57 additional valid Product snippet items.
The final report also showed zero invalid items.
For an ecommerce site, broader valid structured-data coverage gives Google clearer machine-readable information about product pages and increases the number of pages that may be eligible for enhanced product-related search appearances.
Organic growth spread beyond the homepage
Perhaps the most useful result was the way search visibility moved deeper into the site.
Across the ten non-homepage URLs visible in the Search Console report:
Clicks increased from 1,685 to 2,479 — a 47.1% increase
Impressions increased from 39,189 to 51,928 — a 32.5% increase
That is important because a healthy ecommerce SEO strategy should not depend entirely on homepage traffic.
The more relevant product and category pages become visible, the more opportunities the website has to attract users who are already searching for something specific.
Landing-page performance
| Landing page | Clicks before | Clicks after | Click change | Impressions before | Impressions after | Impression change |
| Homepage | 2,000 | 1,738 | -13.1% | 18,063 | 18,240 | +1.0% |
| Thyrocon Tablet | 395 | 635 | +60.8% | 4,469 | 6,188 | +38.5% |
| All Products | 47 | 412 | +776.6% | 1,872 | 7,302 | +290.1% |
| Aam Doshantak Capsule | 166 | 285 | +71.7% | 2,899 | 4,688 | +61.7% |
| Tablets category | 278 | 231 | -16.9% | 12,841 | 13,658 | +6.4% |
| Micon Tablet | 197 | 175 | -11.2% | 4,586 | 3,966 | -13.5% |
| Urico-G Tablet | 181 | 166 | -8.3% | 2,854 | 2,366 | -17.1% |
| Vatantak Tablet | 158 | 147 | -7.0% | 3,202 | 3,856 | +20.4% |
| Hriday Shakti Syrup | 36 | 145 | +302.8% | 318 | 1,953 | +514.2% |
| Vatantak Syrup | 100 | 142 | +42.0% | 3,737 | 4,226 | +13.1% |
| Vatantak Gold Tablet | 127 | 141 | +11.0% | 2,411 | 3,725 | +54.5% |
Not every page improved.
The homepage lost clicks, as did several product URLs.
That makes the results more useful rather than less impressive because it shows where the growth actually happened.
The bigger story is that several important product and category pages gained enough visibility to broaden the site’s search footprint and reduce its dependence on the homepage.
The All Products page became a major organic entry point
The /sc/all-products page delivered one of the biggest improvements in the report.
Clicks increased from:
47 → 412
That is:
- 365 additional clicks
- 776.6% growth
Impressions increased from:
1,872 → 7,302
That is:
- 5,430 additional impressions
- 290.1% growth
For an ecommerce website, this is a useful result because an All Products page can act as an entry point into the wider catalogue.
Users who arrive there through search can then explore multiple relevant products without needing to start from the homepage.
Individual product pages also captured more search demand
Growth was not limited to category pages.
The Thyrocon Tablet page increased from 395 to 635 clicks, a 60.8% rise.
Its impressions also increased by 38.5%.
The Aam Doshantak Capsule page grew from 166 to 285 clicks, an increase of 71.7%.
The standout product page was Hriday Shakti Syrup.
Clicks increased from:
36 → 145
A rise of:
302.8%
Impressions grew from:
318 → 1,953
A rise of:
514.2%
This is a useful sign that the site’s visibility was beginning to reach deeper product URLs, rather than simply building more traffic to top-level pages.
7. Business impact
More of the catalogue became searchable
Increasing indexed pages from 150 to 221 meant more of Jamna Herbal’s catalogue had the opportunity to appear in Google Search.
For a business with a broad product range, that creates more ways for customers to discover the brand.
Instead of every organic journey beginning on the homepage, users can land directly on pages that better match what they were searching for.
Organic traffic grew independently of Paid Social
Organic Search users increased by 1,015, while sessions increased by 1,460 across the two compared periods.
That growth is particularly valuable because it was recorded separately from the site’s Paid Social activity.
It shows that Organic Search was developing as its own acquisition channel rather than relying on wider paid traffic growth.
Search traffic became more distributed across the catalogue
Homepage clicks fell by 13.1%, but the ten other visible landing pages collectively generated 47.1% more clicks.
For an ecommerce site, that can be a healthier pattern.
A user landing directly on a product or category page is often arriving on a page much closer to their actual search intent.
Instead of depending heavily on one top-level URL, the website began generating organic demand across a broader group of commercially useful pages.
Google had more structured information about the product range
Product snippet coverage increased from 2 to 59 valid items.
Breadcrumb coverage also increased to 9 valid items, with no invalid items visible in the final reports.
This gave Google more structured information to help interpret the site, understand the relationship between pages and assess product pages for relevant search features.
Technical growth was supported by healthy page experience
The number of URLs classified as Good in the visible Desktop Core Web Vitals data increased from 104 to 135.
This meant that as more of the website became discoverable and indexed, more URLs were also being recorded within the Good page-experience category.
8. Key takeaways
Indexation can unlock growth across an ecommerce catalogue.
Jamna Herbal added 71 indexed pages. That meant 71 more URLs had the opportunity to earn impressions, clicks and organic traffic.
Homepage performance does not tell the full story.
The homepage lost clicks, yet the ten other landing pages visible in Search Console collectively gained 47.1%. Looking only at the homepage would have missed a large part of the improvement.
Structured data needs to be measured, not simply implemented.
Moving from 2 to 59 valid Product snippet items provided much clearer evidence of progress than simply saying that product schema existed on the site.
Crawl data becomes more meaningful when combined with indexation.
Daily crawl requests increased from 100 to 183 between the visible dates, while the indexed-page count also grew. Looking at both metrics together provides a much stronger picture of how Google was interacting with the site.
Organic Search should always be separated from paid acquisition.
Paid Social grew significantly, but Organic Search still delivered 26.7% more users and 23.4% more sessions on its own.
SEO success should be measured across several signals.
Traffic, indexation, structured data, engagement, crawling and landing-page visibility all tell different parts of the story. Looking at them together gives a much clearer view of whether SEO is genuinely improving.
9. Work with Ashish Bedi on organic growth
Jamna Herbal’s results show why ecommerce SEO cannot be reduced to a rankings report.
The bigger opportunity was to make more of the website available to search in the first place.
Over the reporting period, more pages were indexed, Google crawled the site more frequently, valid Product snippet coverage expanded and several important category and product URLs gained substantially more search visibility.
At the same time:
- Organic Search users increased by 26.7%
- Organic Search sessions increased by 23.4%
- Indexed pages increased by 47.3%
- Clicks across the ten visible non-homepage landing pages increased by 47.1%
- Valid Product snippet items increased from 2 to 59
Ashish Bedi works across technical SEO, ecommerce SEO, Google Search Console analysis, crawl and indexation optimisation, structured data and organic growth strategy.
The focus is straightforward: identify what is holding organic performance back, fix the underlying search visibility issues and help more of the right pages become discoverable to the people already searching for them.